Mayank Bhatt
Transforming Data into Insights | Analytics • Machine Learning • Business & Finance
Leveraging AI, Machine Learning, Python, SQL, Excel, and visualization tools to transform complex data into actionable insights.

About Me
I’m Mayank Bhatt, a B.Com II year student with a passion for Data Analytics and Data Science. My areas of expertise include converting raw data into useful information using data cleaning, trend analysis, and visualization tools.
To me, data is not just a collection of numbers but a powerful decision-making tool that can help businesses grow in a strategic manner. With my experience in Python, SQL, Excel, and Power BI tools, I’m always eager to learn more about the latest tools in the field of Artificial Intelligence and Machine Learning.
What motivates me is the practical implications of data. I don’t only aim to carry out technical analysis but also to effectively communicate the results in a way that facilitates better decisions.I have gained practical experience in data analysis, visualization, and problem-solving through my internships as well as various data-driven projects.
I have managed to close the gap between the theoretical and practical aspects.I am a quick learner, a team player, and I am driven by the desire to transform raw data into valuable insights. I am looking forward to continuous growth in areas where I can make significant contributions.
Skills & Technologies
Python
Pandas | NumPy | Matplotlib | Seaborn | Machine Learning
Skilled in data analysis, manipulation, and Machine Learning using Python to extract insights and support data driven decision-making.
Databases
MySQL | PostgreSQL | MongoDB
Proficient in complex querying, database optimization, and data modeling across relational and NoSQL databases.
AI & Automation
AI Tools | Intelligent Automation | AI Agents
Proficient in leveraging AI tools for data analysis, natural language processing, and building intelligent agents to automate tasks and improve efficiency.
Machine Learning
Supervised | Unsupervised | Model Evaluation
Skilled in building and evaluating machine learning models, including regression, classification, and clustering, to uncover patterns and make predictions.
Data Visualization
Power BI | Excel | Tableau | Looker Studio
Skilled in designing interactive dashboards and visualizations using Power BI, Excel, Tableau, and Looker Studio to transform data into actionable insights.
Excel
Advanced Excel | Data Analysis | Reporting
Proficient in Excel for data analysis, reporting, and dashboard creation using advanced functions, pivot tables, and data cleaning techniques.
Featured Projects
Freelancing Projects and Internship Experiences
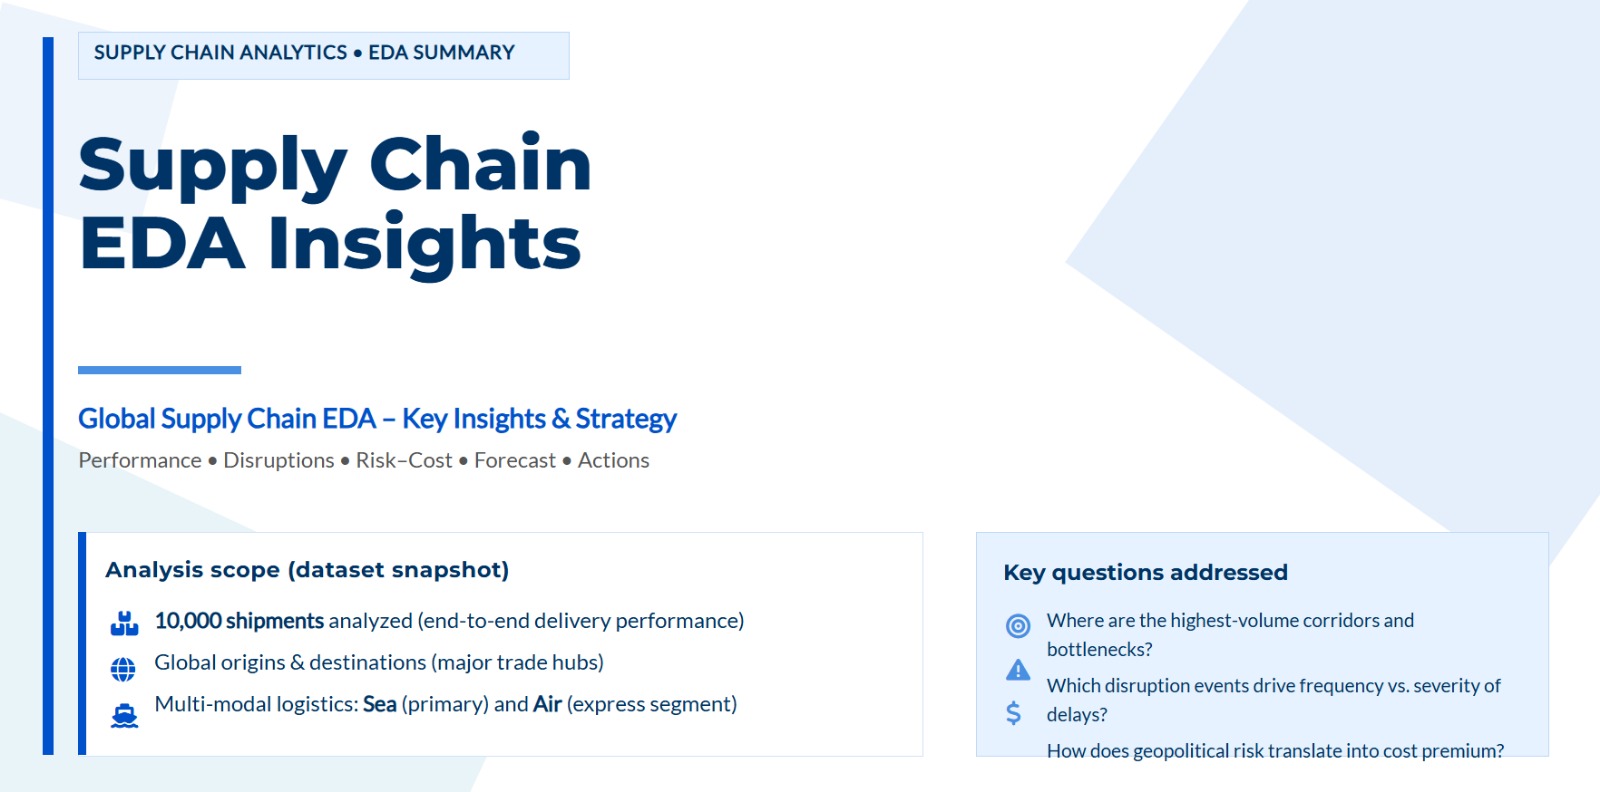
Supply Chain Analytics
Data Analysis
Issued 6th March 2026
AI website audit agent system
AI Agent Project
Issued 9th March 2026

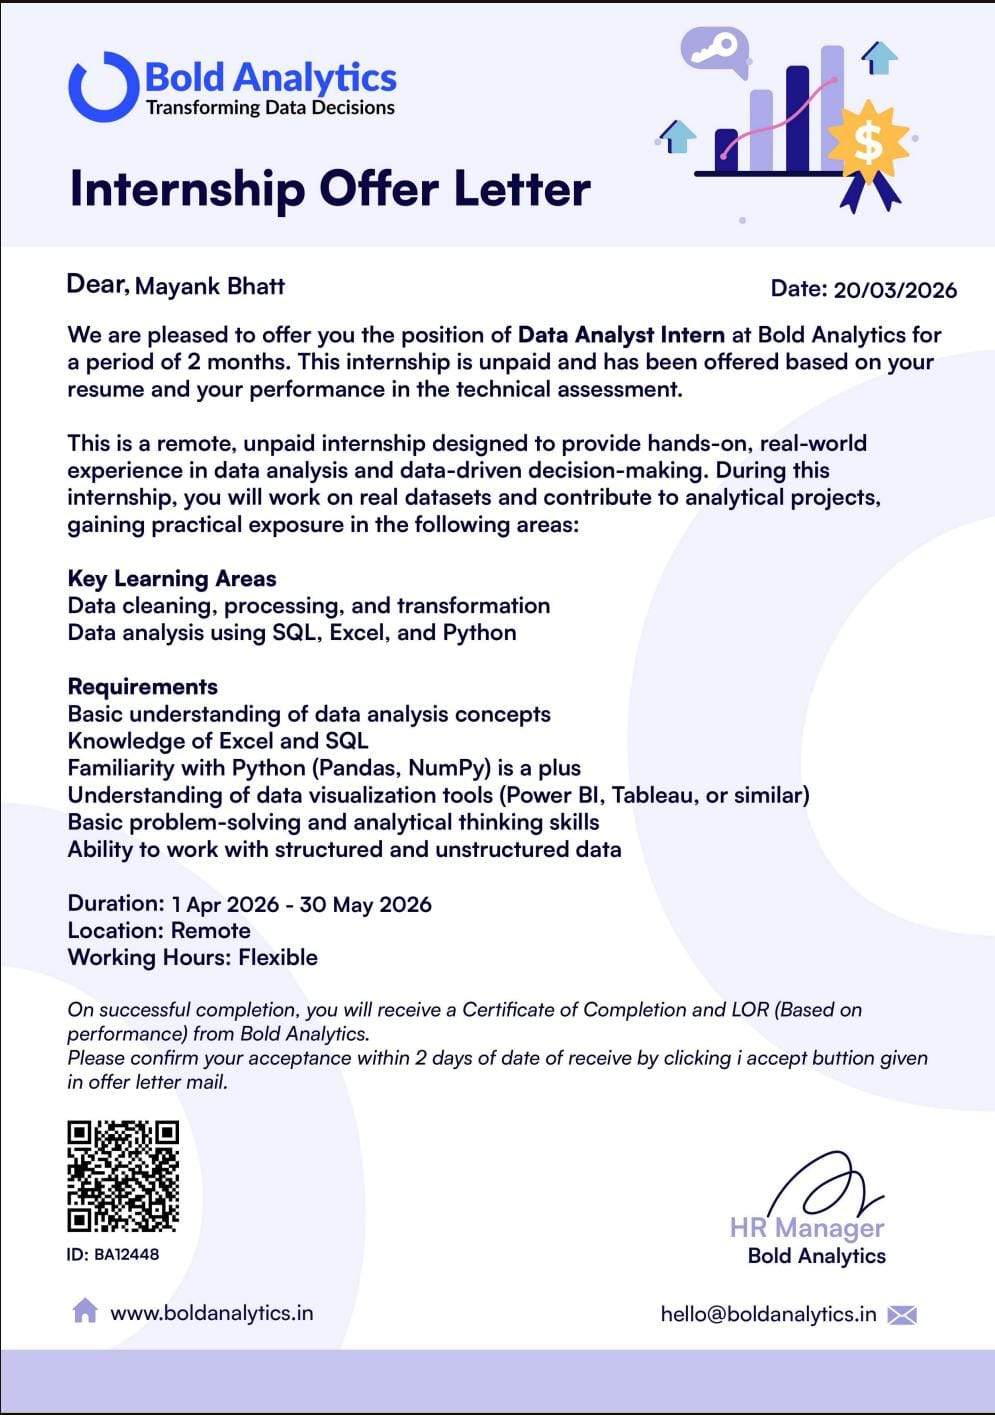
Data Analyst Intern
Bold Analytics
Issued 1th March 2026
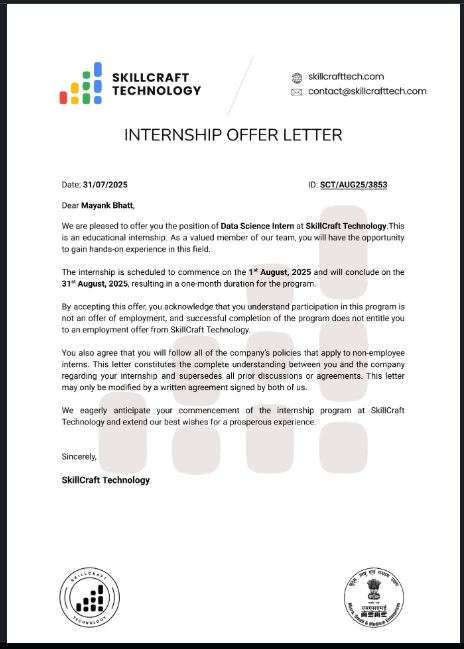
Data Analyst Intern
SkillCraft Technology
Issued 1th August 2025
Data Scientist Intern
CodSoft
Issued 1th June 2025
Certifications & Achievements
Certificate of Participation
Futurion Tech
Issued 6th March 2025
Data Science & Analytics
Cisco
Issued 9th December 2024
Excel Formulas & Function
Simplilearn
Issued 5th December 2024
Data Analytics by Quantium
Quantium
Issued 17th March 2025
Certificate in Data Analytics
HP LIFE
Issued 10th December 2024

Data Visualization Job Simulation
Accenture
Issued 14th December 2024